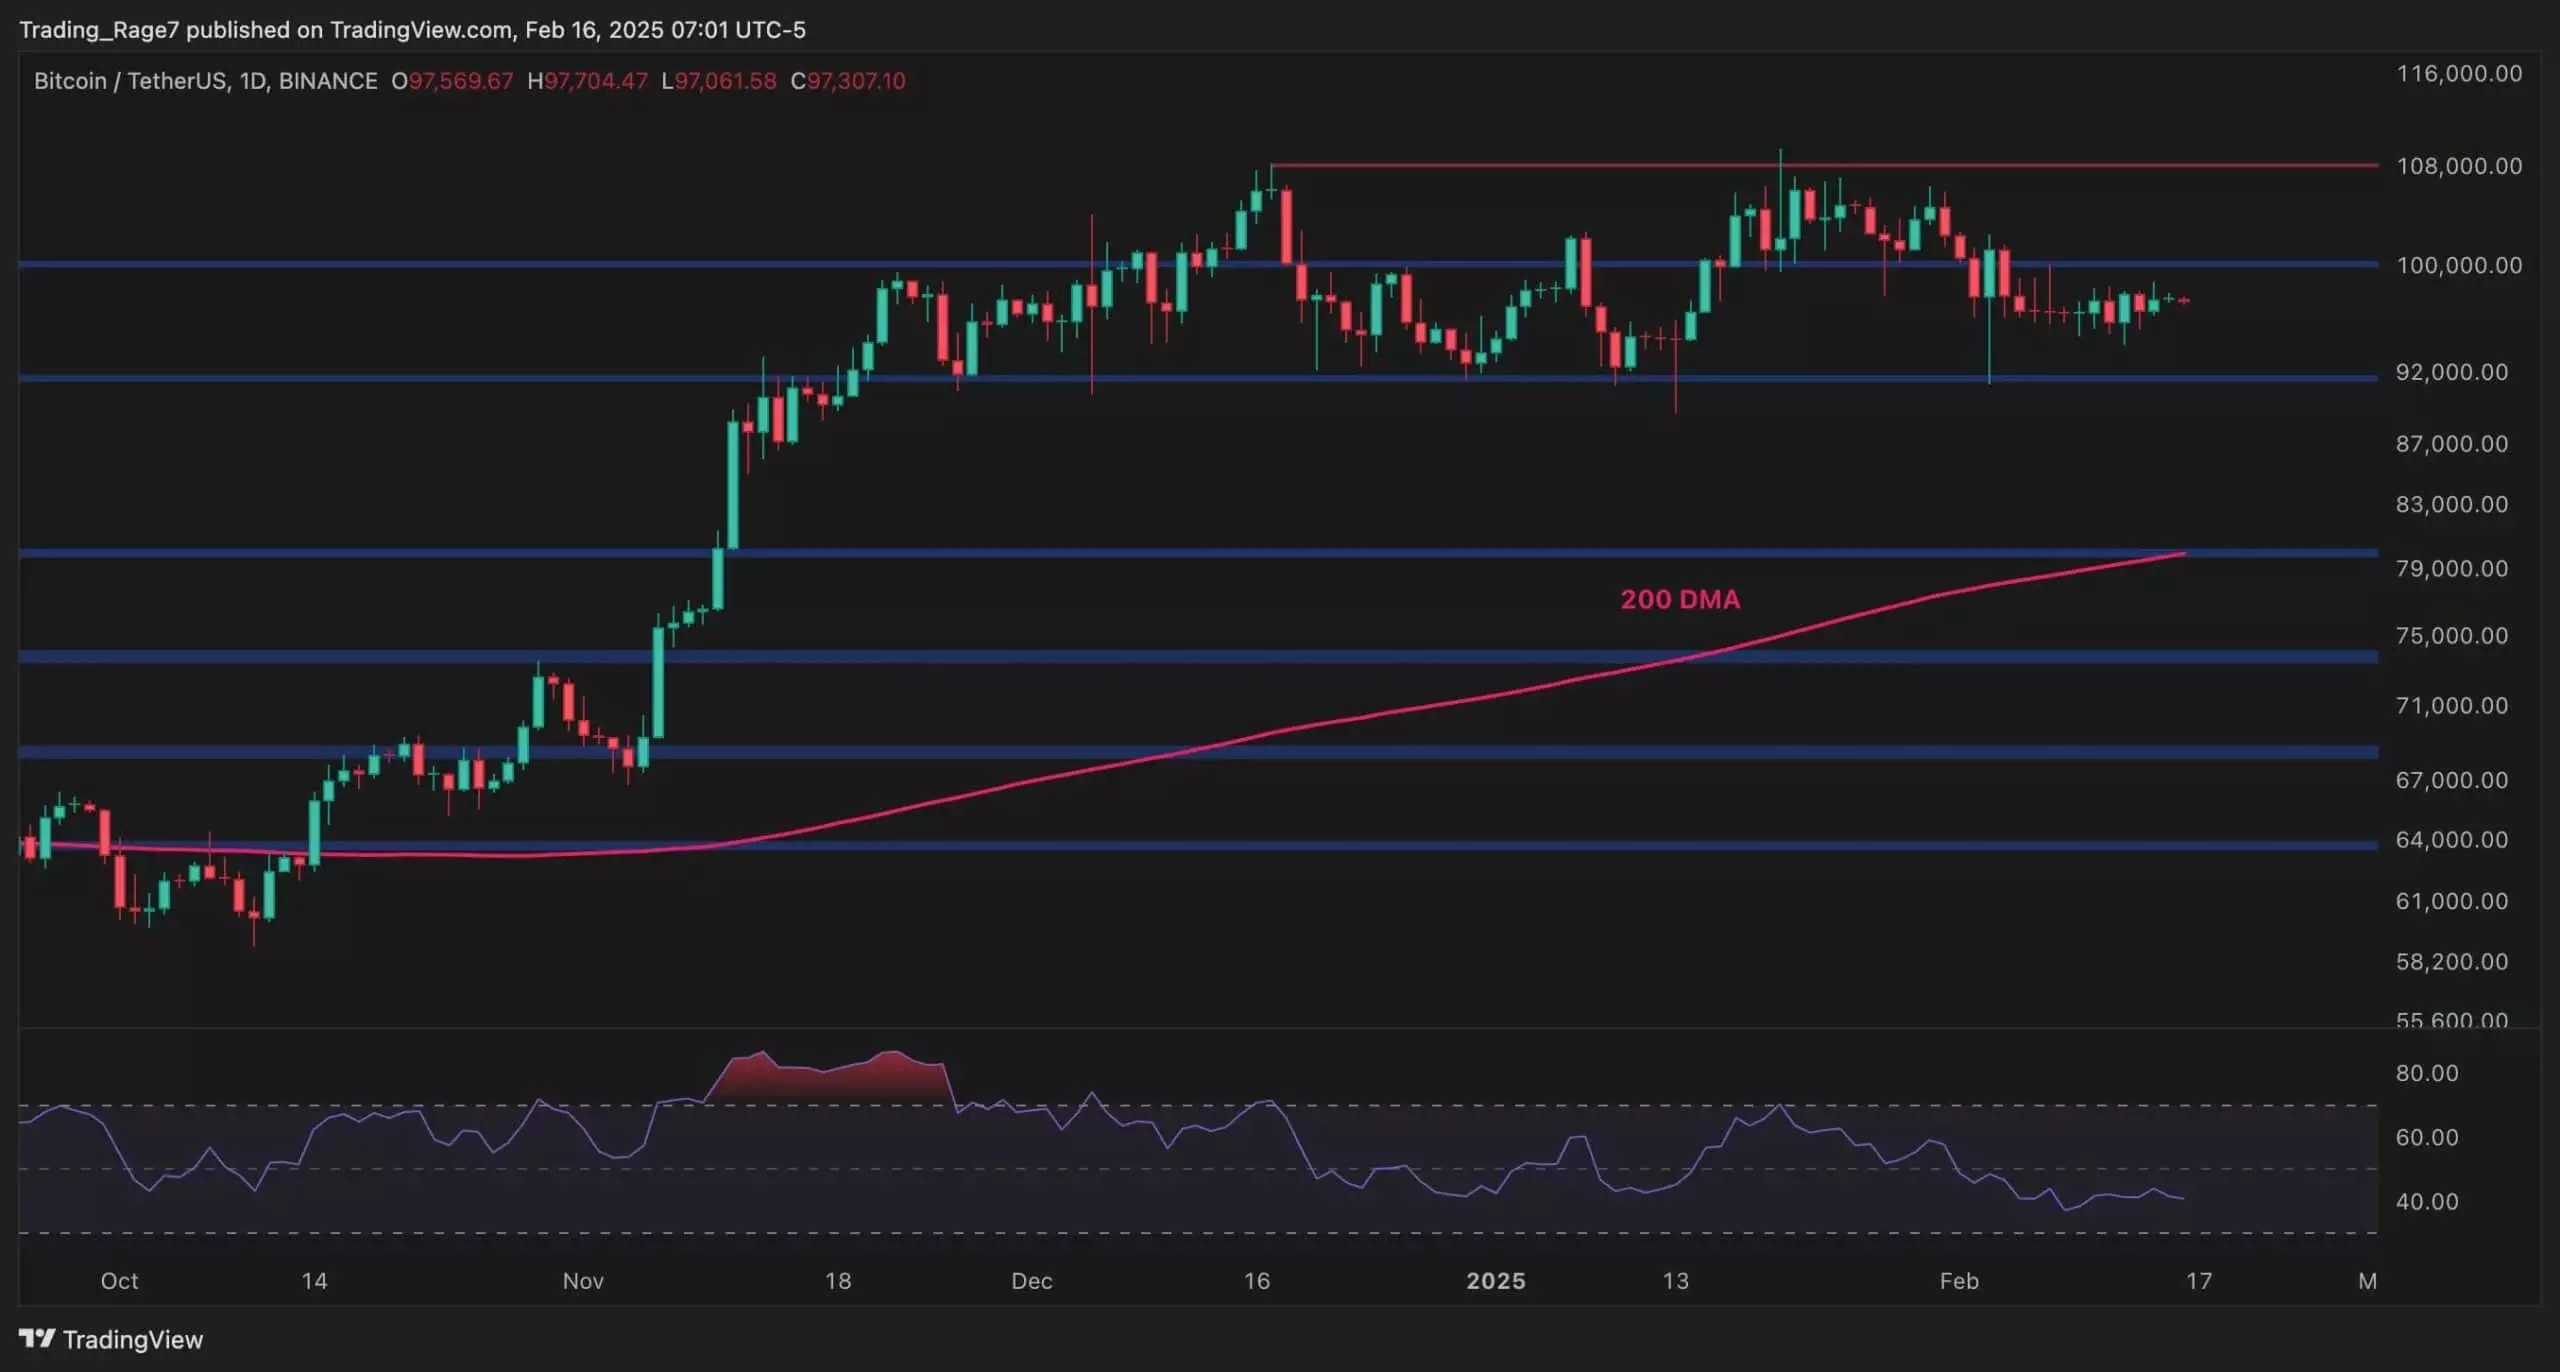
Bitcoin’s recent price action has been characterized by significant consolidation, signaling a potential inflection point for the cryptocurrency market. Following a fall from its previously celebrated heights of over $100K, Bitcoin’s price has wavered within a narrow trading range, with key support at approximately $92K. This period of relative stasis prompts critical questions: is this behavior indicative of accumulation by optimistic investors, or is it a classic distribution pattern suggesting a pending downturn? As traders and analysts scrutinize the charts, the answers may lay the groundwork for the next phase of the Bitcoin market.
Technical Analysis Insights
Analyzing Bitcoin’s price movement reveals valuable insights into market sentiment. The daily chart illustrates a sideways trajectory, underscoring a lack of strong momentum in either direction. Notably, a bearish momentum is suggested by the Relative Strength Index (RSI), which resides below the 50% threshold. Despite this bearish sentiment, Bitcoin still holds above the crucial 200-day moving average at around $80K—this level often serves as a pivot point for traders. A deepened decline approaching this area could necessitate a serious reevaluation of bullish sentiment among investors, especially before any potential recovery.
On the shorter time frame, the emergence of a symmetrical triangle formation on the 4-hour chart hints at tension between bulls and bears within the market. As traders await a definitive breakout, the unresolved nature of this pattern adds complexity to forecasting Bitcoin’s immediate future. A retest of the lower boundary seems imminent, especially after a recent touch at the upper threshold. If the impending tests yield a breakdown, the anticipation of price dipping towards $92K may induce further market anxiety.
As the price churns within this constrained range, understanding the motivations of market participants becomes critical. One metric that serves as a valuable lens into trader behavior is Bitcoin’s exchange reserves—the amount of Bitcoin held in exchange wallets. An analysis of this metric shows a dramatic fall recently, hinting at broader accumulation phases when traders pull coins away from exchanges to hold long term. However, recent rebounds in exchange reserves correlate with growing uncertainty among traders, reflecting a potential distrust in the current bullish narrative.
This tug-of-war between increasing reserves and the inherent price volatility accentuates a lack of confidence in a clear bull market trajectory. If those reserves continue to swell, selling pressure could catalyze a downward trend. Therefore, traders and analysts must stay vigilant, continuously assessing shifts in both price action and exchange reserve metrics to navigate these choppy waters effectively.
Bitcoin is entrenched in a phase of uncertainty, oscillating between potential bullish accumulation and bearish distribution. With technical indicators suggesting a likely short-term pullback and market sentiment wavering, the coming days hold critical importance for Bitcoin traders. Watches on key price levels like $92K and $80K are essential, as they could dictate substantial market movements. Ultimately, only time will unveil Bitcoin’s next chapter as both accumulation strategies and market dynamics continue to evolve.

