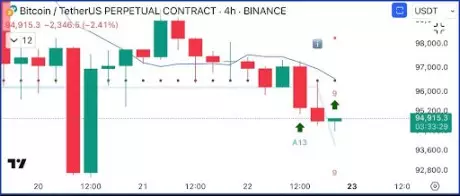
In the fast-paced world of cryptocurrency, informed trading decisions often hinge on technical analysis. Recently, a well-known crypto analyst, Ali Martinez, highlighted a compelling buy signal for Bitcoin from the TD Sequential chart, suggesting an inflection point for investors. This article delves into the implications of such signals, the tools used for analysis, and the broader market context for cryptocurrency investments.
The TD Sequential is a sophisticated technical indicator primarily used to identify potential price reversals by examining the exhaustion of market trends. It utilizes a sequence of candles on price charts to signal the prevailing trend’s health and potential turning points. In this context, Martinez’s observation of a “green 9” candle on Bitcoin’s 4-hour chart signifies an approaching saturation of bearish momentum. When such a signal emerges, it often invites traders to consider market entry, as it indicates the possibility of a rebound.
Investors must acknowledge that a “green 9” is not merely a standalone indicator; it is part of a more complex analysis involving other markers, like the “A13.” This countdown phase highlights the development of a potential trend exhaustion pattern, representing 13 additional candles following the initial signal. In a bearish market, the presence of this “A13” often generates heightened anticipation for a price reversal. Thus, Martinez’s analysis does not just indicate a singular entry point—it’s a framework for traders to gauge market momentum and sentiment.
As Bitcoin approached a price point of $94,000, Martinez underscored the $94,915 level as optimal for traders looking to capitalize on the anticipated price rebound. The motivation behind this entry point stems from the interplay between technical signals and price action. When investing in cryptocurrencies, setting entry and exit points is crucial, and the TD Sequential signals provide a foundation upon which traders can build their strategies.
However, it is essential to exercise caution. Though indicators hint at positive momentum, broader market dynamics and volatility can drastically alter price trajectories. Investors must remain vigilant and account for potential risks, including macroeconomic factors that could influence the cryptocurrency market at large.
In a follow-up post, Martinez extended his analysis beyond immediate short-term signals to long-term price predictions based on the Mayer Multiple. This tool, which compares Bitcoin’s price to its 200-day moving average, serves as a historical benchmark for understanding market tops. The current Mayer Multiple sits at 1.3845, suggesting a significant gap before it reaches the alert threshold of 2.4, which historically correlates with price peaks around $168,500.
The predictive power of the Mayer Multiple lies in its ability to give investors insights into potential overbought conditions within the market. As Bitcoin’s price increase continues, reaching the critical level of 2.4 could mark a pivotal moment, presenting both opportunities and risks for traders. Speculating on the ascent of Bitcoin to the stated price range necessitates a nuanced understanding of market dynamics, investor psychology, and external economic factors.
While tools like TD Sequential and the Mayer Multiple provide valuable insights, they should not be the sole determinants in an investor’s decision-making process. The cryptocurrency market is often marred by volatility and susceptibility to sudden shifts in sentiment and macroeconomic factors. Traders must combine technical indicators with a comprehensive analysis of market conditions, investor behavior, and global economic events.
Therefore, it’s imperative not just to observe indicators, but to develop an agile approach that allows for swift adaptation to changing market conditions. The interplay of these factors can tremendously influence price movements, urging investors to build well-rounded strategies when trading.
While valuable signals like those shared by Ali Martinez can highlight opportune moments within the cryptocurrency landscape, they should serve as part of a broader trading strategy. As the market evolves, so too must the analyses and methodologies employed by investors, ensuring that they remain not only informed but adaptable to the ever-shifting tides of cryptocurrency trading.

