Ethereum has recently found itself at a pivotal juncture, characterized by distinct technical patterns that signal potential movement in the market. As traders and investors keep a close eye on these developments, understanding the implications of the current charts and price action becomes paramount.
Current Market Dynamics
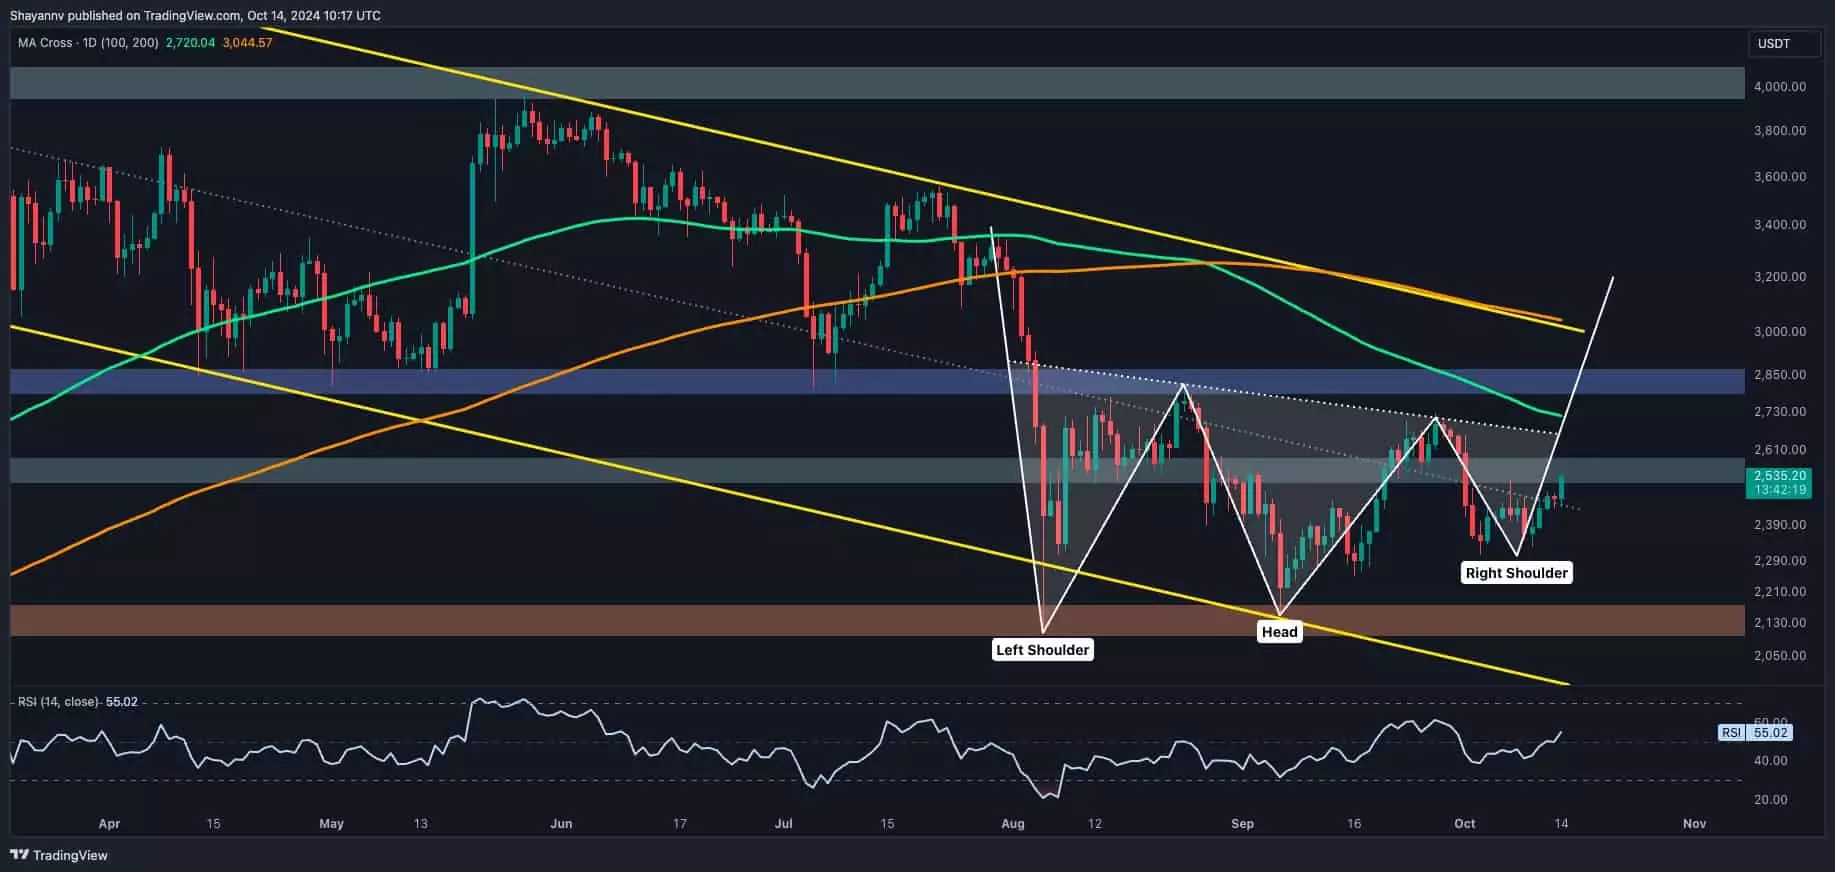
Ethereum (ETH) has been experiencing a notable phase of consolidation, exhibiting no clear directional momentum in its price action over the past weeks. Market participants are now focusing on an emerging inverted head and shoulders pattern on the daily chart, which typically represents a bullish reversal. This pattern has materialized near the $2.1K support zone, a significant price point where buying pressure has proven resilient. With this formation capturing market attention, traders are weighing the possibility of a bullish shift, particularly if Ethereum can breach its neckline around $2.7K.
This neck level is crucial, as it serves as a threshold that, if overcome, could validate the bullish reversal and potentially lead ETH toward a test of further resistance at the $3K mark. Meanwhile, ETH’s recent move back to the center of a multi-month trading channel—around the $2.5K level—indicates a recovery from previous lower valuations, positioning the cryptocurrency at a delicate balance point.
Short-Term Technical Patterns
On the 4-hour chart, Ethereum’s price action tells a more dynamic story. Sellers have struggled to push the price below the ascending flag pattern’s lower boundary situated near $2.3K. This floor has been tested multiple times, exhibiting a pattern of strong buying at this level that could suggest underlying bullish sentiment. However, should this boundary break, the next support level to watch is the $2.1K threshold, which may act as a last line of defense before a significant sell-off transpires.
Interestingly, within the same timeframe, ETH has also established a double-bottom pattern—another classic bullish indicator that typically suggests a potential reversal in momentary price weakness. This combination of patterns reveals that despite prevailing bearish pressure, a glimmer of bullish potential remains, contingent on the market’s ability to maintain momentum above these key support levels.
Understanding liquidity zones is vital for interpreting potential market movements. The Binance liquidation heatmap provides insights into concentrated areas of liquidity that can significantly influence Ethereum’s trajectory. Currently, the $2K mark shows robust defense from both institutional traders and market “whales,” revealing a solid demand foundation that should continue to support prices.
Conversely, the $2.8K resistance continues to be a formidable hurdle for Ethereum. This point has attracted considerable liquidity, as traders have strategically placed their stop-loss orders in anticipation of price fluctuations. Thus, the proximity of these liquidity zones indicates that significant traders are positioned to react quickly to price movements, which can result in a cascading effect should a breakout occur in either direction.
In the face of these market dynamics, Ethereum finds itself at a crossroads. It is currently bound within a trading range colored by the $2.1K support line and the $2.7K resistance ceiling, presenting a scenario ripe for volatility. Should ETH manage to break above the neckline at $2.7K, traders can expect heightened bullish momentum, potentially driving prices towards the sought-after $3K level.
Conversely, a decline through key support levels risks triggering a long-squeeze event, spearing a rapid descent toward the $2K level. Given the liquidity zones identified, this scenario could be accompanied by a swift cascade of liquidations, amplifying selling pressure and further defining the bearish trend.
The prevailing technical patterns, combined with insights from liquidity zones, create a complex but insightful portrait of Ethereum’s next potential moves. Both bullish and bearish scenarios are plausible, and remaining vigilant to emerging trends will be essential for participants in this ever-evolving cryptocurrency landscape.

