Bitcoin’s recent ascent has not gone unnoticed, as it has successfully surpassed the significant threshold of $64,000, positioning itself towards an ambitious all-time high. This pivotal move is crucial in the broader context of its market performance. A comprehensive analysis indicates that alongside this price breakout, the cryptocurrency has also crossed above the 200-day moving average, a vital indicator of long-term market trends. This convergence of price action and moving average creates a compelling narrative of potential bullish momentum, poised to push Bitcoin toward the $68,000 resistance zone.
From a technical analysis standpoint, the Relative Strength Index (RSI) is showing signs of increasing bullish sentiment. Such indicators suggest that, barring any unforeseen corrections, Bitcoin’s trajectory appears set for continued growth in the immediate future. Should market dynamics shift, sustaining above the 200-day moving average offers a buffer that could mitigate any drastic downward movements, reinforcing support in the ongoing market uptrend.
Analyzing Short-Term Market Movements
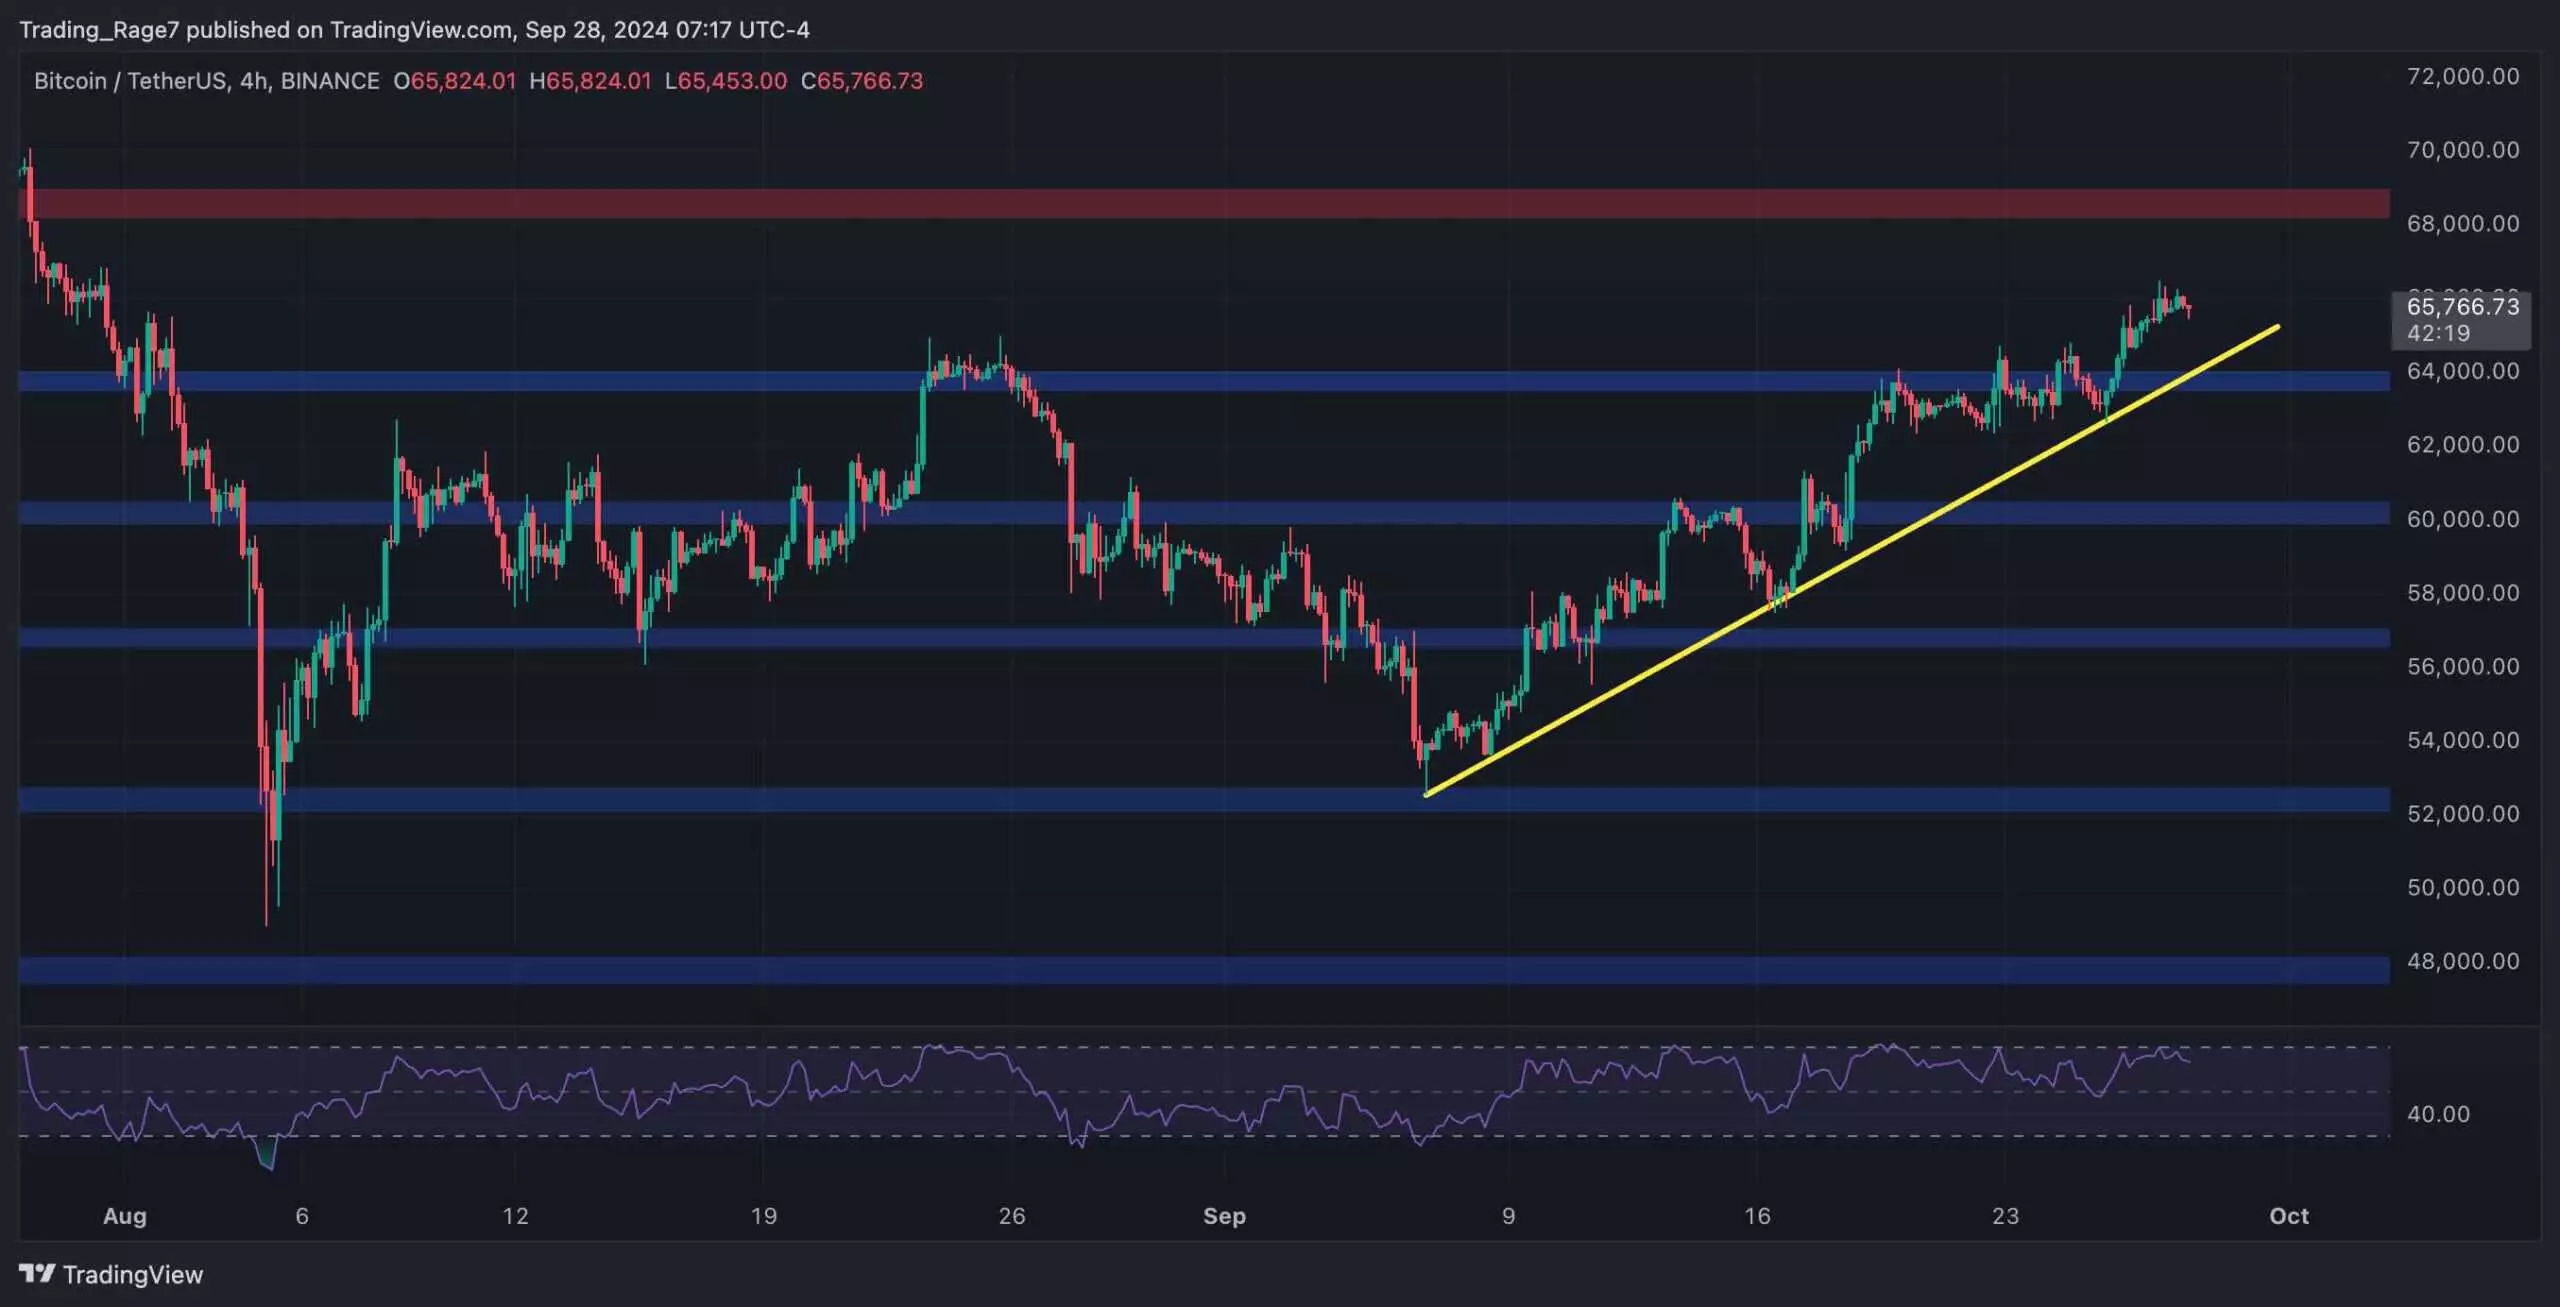
Diving deeper into shorter time frames, particularly the 4-hour chart, reveals a pattern of higher highs and higher lows, establishing a clear bullish trend since the rebound from the significant support level of $52,000. This compelling upward trendline has presented a robust support mechanism, indicating that market confidence is gradually solidifying around these price levels. As long as this trendline remains intact, predictions favor a price move towards the $68,000 mark, fueled by the momentum already established.
However, market sentiment can be fickle. Should this trendline be breached, a corrective pullback to around $60,000 becomes a probable scenario. This highlights a crucial aspect of trading psychology — the balance between optimism driven by upward momentum and the fear of potential losses leading to a market correction.
Understanding Investor Behavior: Short-Term Holders
Amidst these price movements, the conversation shifts to the actions of short-term holders. Recently, a notable trend has emerged among this group, who, despite being at a loss during the periods of consolidation and correction, opted to sell their holdings in panic. This behavior has significant implications for market liquidity and sentiment.
The Short-Term Holder SOPR (Spent Output Profit Ratio) offers insights into this phenomenon. Initially, this ratio reached a record high when Bitcoin first touched the $70,000 mark, indicating profitable realizations among short-term investors. However, a decline in this metric since then has revealed a different story — one of loss realization and retreat among these investors. The recent price rally has brought some relief, allowing short-term holders to return to profitability, yet it raises concerns about potential selling pressure in the wake of profit-taking.
The current market landscape for Bitcoin is rich with opportunities and risks. The dynamics of price levels, investor behavior, and technical indicators paint a complex picture that traders and investors must navigate carefully. If the upward trend can sustain itself amidst profit-taking and broader market demands, Bitcoin may continue its journey toward new heights. Conversely, the presence of selling pressures could signify caution and possible market corrections, making astute analysis and strategy essential on this volatile path ahead.

