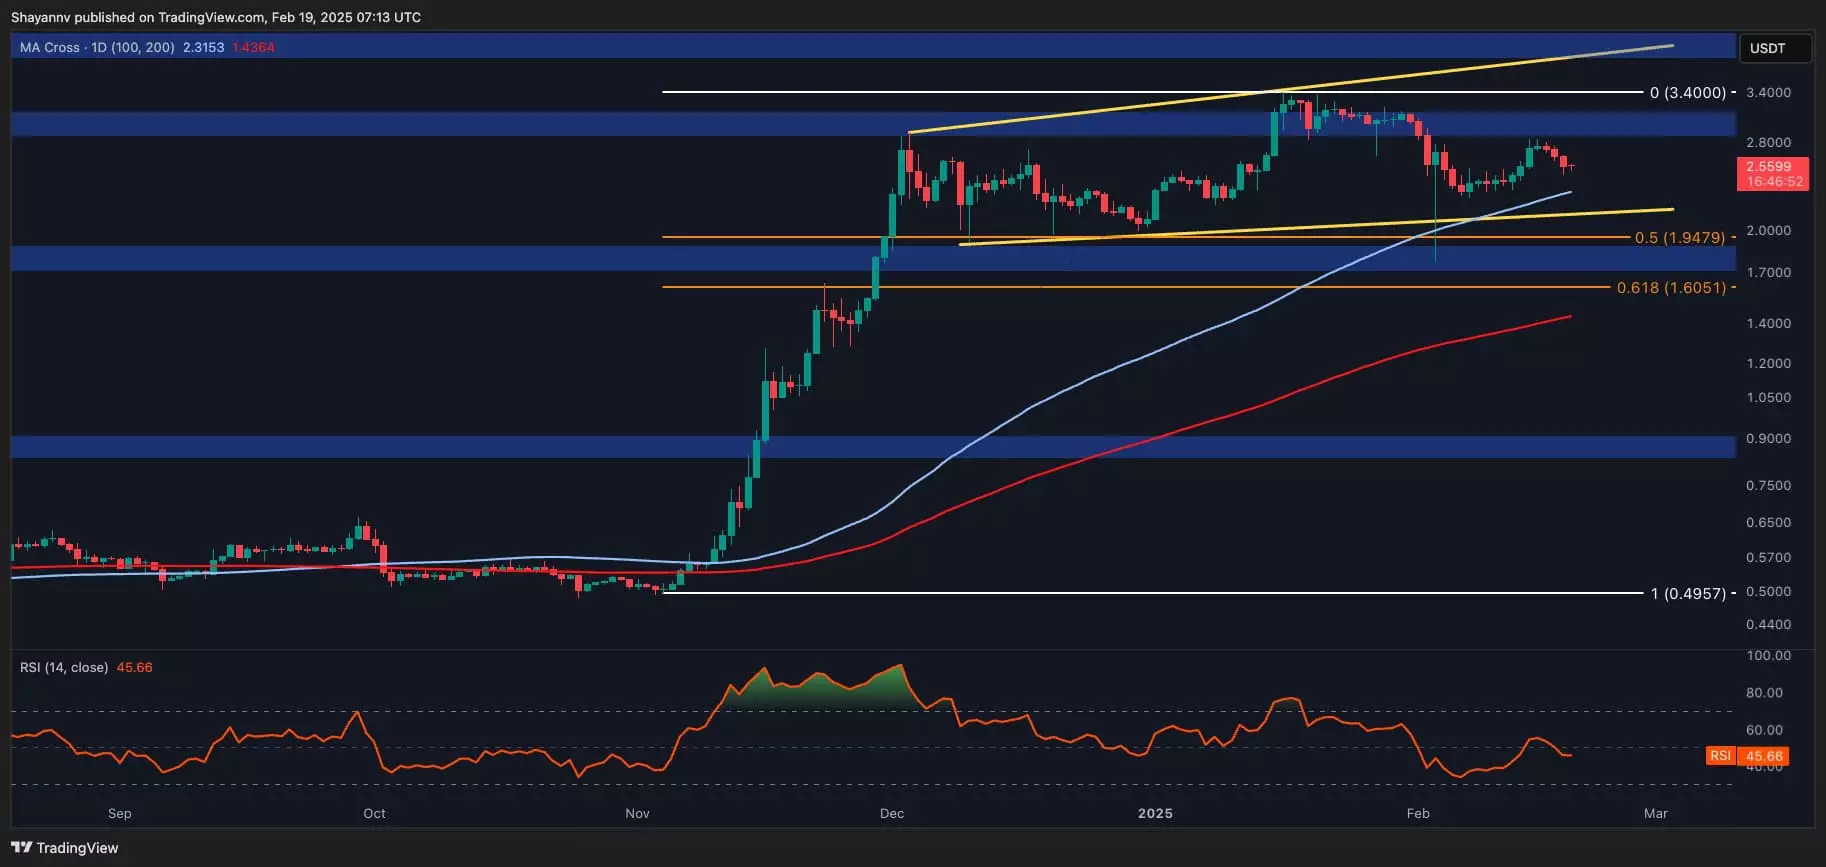
Ripple has recently encountered some resistance at the $2.8 level, resulting in a minor price decline. This momentary setback, however, is not necessarily indicative of an ongoing bearish trend. Rather, Ripple is approaching a critical support zone that could signal a potential bullish reversal. The price movement has been characterized by volatility as it navigates through an expanding wedge formation, showcasing periods of consolidation that point to reduced trading volume and market indecision. This situation highlights the importance of key support levels that may offer a safety net for buyers.
One of the most crucial support mechanisms for Ripple can be found near the 100-day moving average, currently situated around the $2.3 mark. This level serves not only as a technical indicator but also as a psychological benchmark for traders. The $2 support range further signifies another critical threshold that could arrest any downward momentum. Additionally, Fibonacci retracement levels add another layer of significance to Ripple’s technical landscape. The support corridor defined by the 0.5 Fibonacci level at $1.9 and the 0.618 level at $1.6 creates a sturdy structural foundation that trading activity may gravitate toward in times of heightened volatility.
In the immediate term, traders should expect further consolidation as the market waits for a clear directional signal. The rejection at the $2.8 resistance implies that sellers are still active, but they face formidable barriers just below—particularly the descending wedge’s lower boundary around $2.3. If Ripple’s price manages to hold above this level, it will likely create an environment conducive to a bullish rebound. Conversely, a break below the $2.3 line could catalyze additional selling pressure, risking a significant drop to the crucial $2 support if panic selling ensues.
Ripple’s current price action necessitates close monitoring given its proximity to key technical levels. Traders should be vigilant as the asset weathers turbulent market conditions while remaining in an expanding wedge pattern. The confluence of major support zones—including the 100-day moving average and critical Fibonacci retracement points—suggests that the potential for a bullish turnaround is tangible. However, should these levels fail to hold, there may be heightened volatility and risk of further declines. Therefore, acting on informed technical analysis will be critical for both short-term and long-term traders looking to capitalize on Ripple’s price dynamics.

